Measurements
Creating a predictive apple quality model with NIR spectroscopy
The two most often-used fruit quality parameters are soluble solid content (SSC) and dry matter (DM). Unfortunately, conventional measurements are destructive, laborious, and time-consuming. So, near-infrared spectroscopy tools, which can take non-destructive quality measurements throughout the supply chain, are gaining popularity. Building and selecting the proper models to analyze the near-infrared spectra can make all the difference to the accuracy of these tools.
07 February, 2022
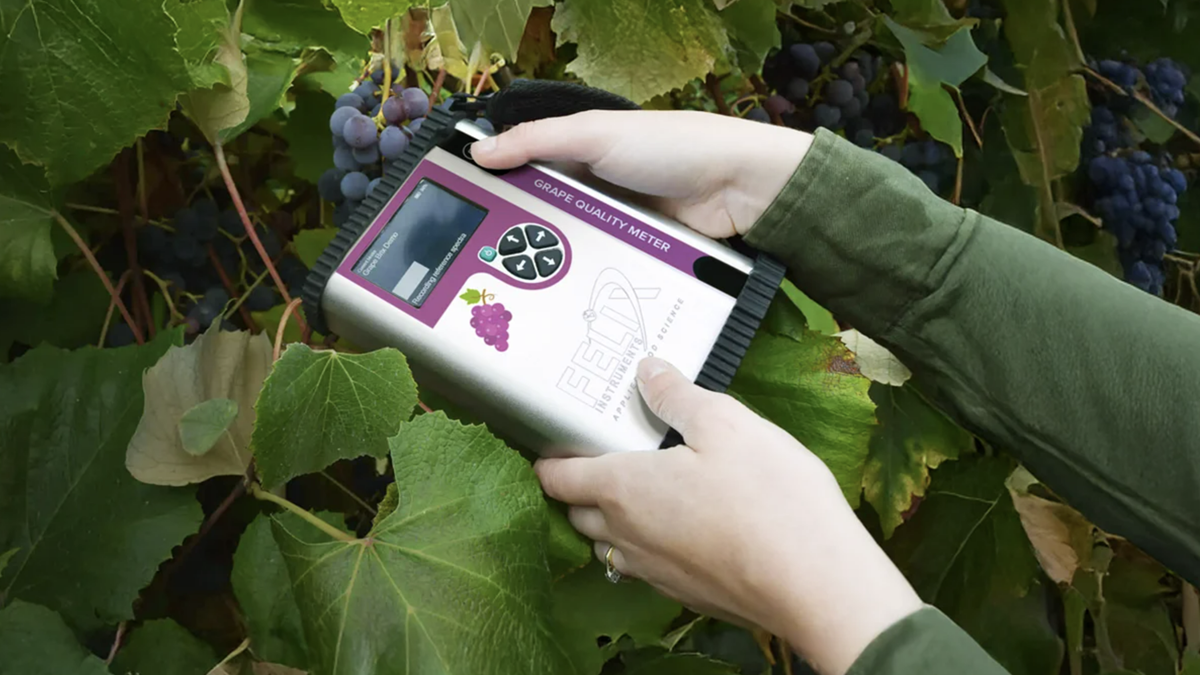
The two most often-used fruit quality parameters are soluble solid content (SSC) and dry matter (DM). Unfortunately, conventional measurements are destructive, laborious, and time-consuming. So, near-infrared spectroscopy tools, which can take non-destructive quality measurements throughout the supply chain, are gaining popularity. Building and selecting the proper models to analyze the near-infrared spectra can make all the difference to the accuracy of these tools. Developing NIR spectroscopy models for apple cultivarsEarly Near-Infrared (NIR) spectroscopy models for apples were built using single cultivars but used for many other varieties. Hence, Zhang, Nock, Al Shoffe, and Watkins, horticulturists from Cornell University, developed multi-cultivar and individual models to predict SSC and DM of eight apples (Malus × domestica Borkh) varieties: 'Gala', 'Honeycrisp', 'Mclntosh', 'Jonagold', 'NY1? (SnapDragon), 'NY2 (RubyFrost) 'Fuji' and 'Red Delicious' Harvesting the fruitsThe fruits of the eight cultivars were harvested in 2016 from the Cornell University orchards at three locations - Ithaca, Geneva, and Lansing. The scientists gathered 640 uniform fruits of seven cultivars, but only 560 of 'Red Delicious' due to preharvest drop. In the second year of the experiment, the scientists collected apples of all eight varieties from the three initial locations, as well as commercial orchards in Hudson Valley and Western New York. The number of fruits collected from each cultivar varied from 160 to 280, depending on the number of harvests. The scientists measured the apples' quality parameters each year on harvest day and after several storage lengths. In 2016, fruits were evaluated after 4, 8, and 12 weeks of air storage, and after 8, 16, and 24 weeks in controlled atmosphere (CA) storage.In 2017, evaluations were limited to 8 weeks in air and 24 weeks in CA storage. Fruit evaluationsThe harvest indices estimated were delta absorbance (IAD), firmness, and starch pattern index (SPI), using four replicates of ten fruits on the day of harvest. The horticulturists wanted to employ a tool that used NIR interactance as the scanning mechanism. Ultimately, they chose a commercially available NIR spectrophotometer, the F-750 Produce Quality Meter. The Produce Quality Meter, produced by Felix Instruments - Applied Food Science, has a Carl Zeiss MMS-1 spectrometer. The tool was determined to be reliable, as many previous studies had used it to estimate quality parameters in fruits and vegetables like apples, cherries, mangoes, pears, tomatoes, onions, and garlic. Spectral data were collected in the range of 310 to 1100nm, at 3nm resolution. Since spectra can be affected by temperatures, fruits were kept at 20°C for 4 hours prior to evaluation on harvest day. Stored fruits were stabilized at the same temperature for 24 hours. Scientists placed each fruit on the lens of the NIR tool, on its equatorial side, and the scanned area was marked. 2.7cm bore samples were then taken from the marked areas to collect reference data for SSC and DM. The researchers estimated SSC using refractometers and DM by oven drying. ChemometricsPredictive models were built using chemometrics to analyze the spectra and estimate SSC and DM. The horticulturists used the Felix Instruments software and spectral data from the fruits collected in 2016 to develop calibration models using Partial Least Square Regression (PLSR). The calibration models were tested by internal and cross/external validation to assess model accuracy. Internal validation used data from 2016, which was part of the same data set used to calibrate the model. Some fruits from 2016 were also set aside for the first round of cross-validation. During the "leave-one-out" cross-validation, the researchers held back one sample from the data set to calculate the reduction residual; the rest were used in the validation. The tests were repeated until every fruit sample had been left out once from the testing data set. Fruits from 2017 were used for further "leave-one-out" cross-validation.



.jpg)
